Visualisations
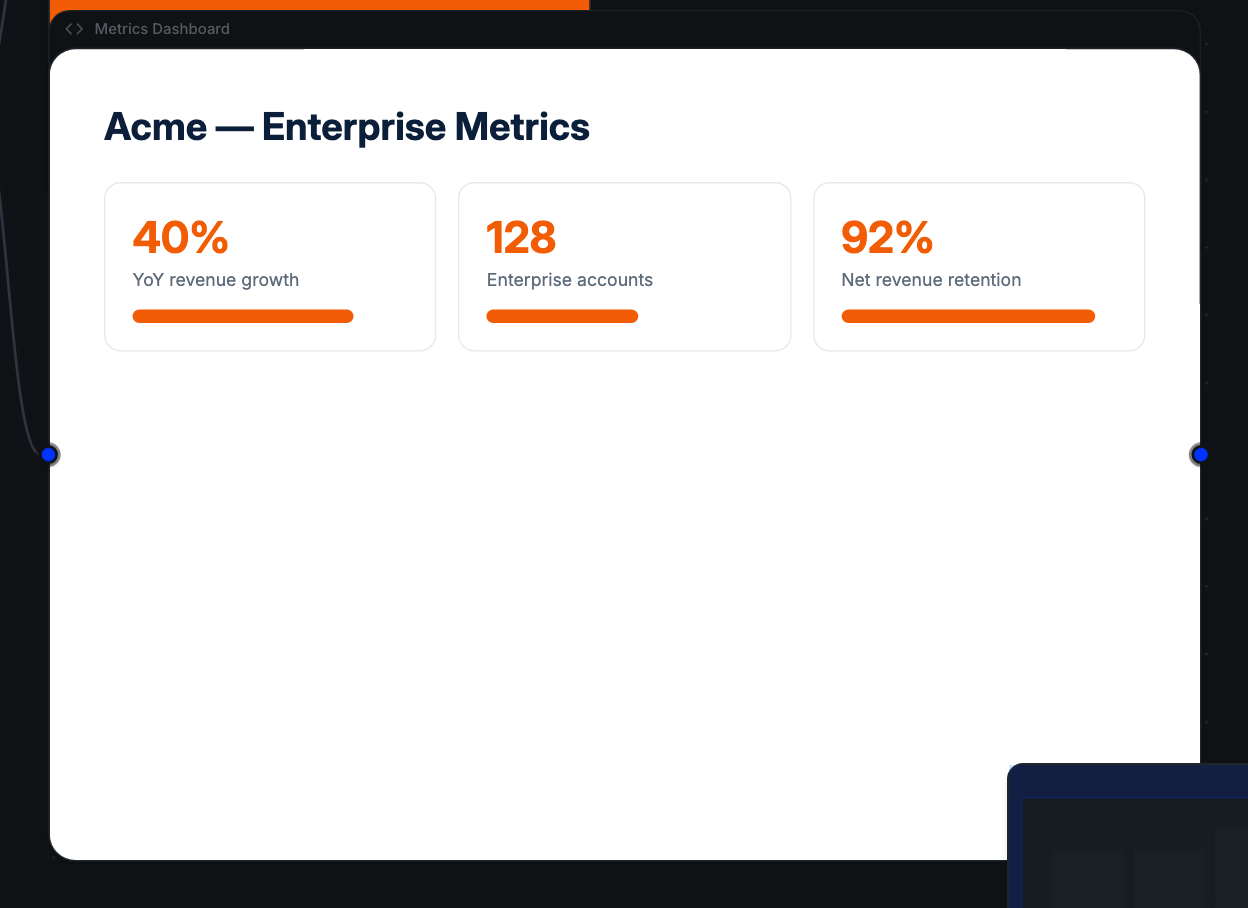
An interactive, on-brand visual piece built on the canvas — dashboards, infographics, interactive charts and diagrams — that you can refine by asking Alto, then export or publish.
A Visualisation is an interactive, self-contained visual artifact you build on the canvas — an infographic, a dashboard, an interactive chart or diagram, a one-page summary. Where a document is words and a presentation is slides, a visualisation is a live, rendered piece: it can have working charts, a map, a stepped-through diagram, or a small interactive layout.
What you can build
Visualisations are real interactive HTML, so they go beyond a static image:
- Data-viz and dashboards — charts and metrics that render live.
- Diagrams — flow, sequence, and relationship diagrams.
- Infographics and one-pagers — a headline metric, sections, a visual story.
- Interactive layouts — maps, stepped or filterable views, light interactivity.
They come out on-brand automatically — your brand colors and fonts are woven in, so a visualisation looks like your work, not a generic template.
How it's built
A visualisation is generated agentically, section by section, so a complex piece builds up reliably rather than in one fragile shot. Larger ones unfold over more than one pass — the work pauses and resumes on its own until the full set of sections is assembled — so an ambitious infographic still completes.
Before it's shown, the visualisation is run in a real browser and checked: the platform actually executes it and flags problems that only appear at runtime — script errors, assets that fail to load, or interactivity that's declared but never starts. So what lands on the canvas is a piece that actually works, not a draft that breaks when you open it.
Because it's an agent node under the hood, a visualisation runs in the background and reports progress while it builds — you don't wait on it.
Refining it
You don't regenerate the whole thing to make a change. Ask Alto for an edit and it works surgically — revising just the section you mean and leaving the rest untouched. You can:
- Revise a section — "make the chart a bar chart and add a trend line," "tighten the copy and use the brand accent."
- Add a section — a new block, styled to match the ones around it.
- Restructure — remove, reorder, or relabel sections, or change the overall layout.
Exporting and publishing
A finished visualisation isn't trapped on the canvas:
- Export it to PNG or PDF for a deck, a report, or an email.
- Publish it as a live, shareable link — see sharing & live links.